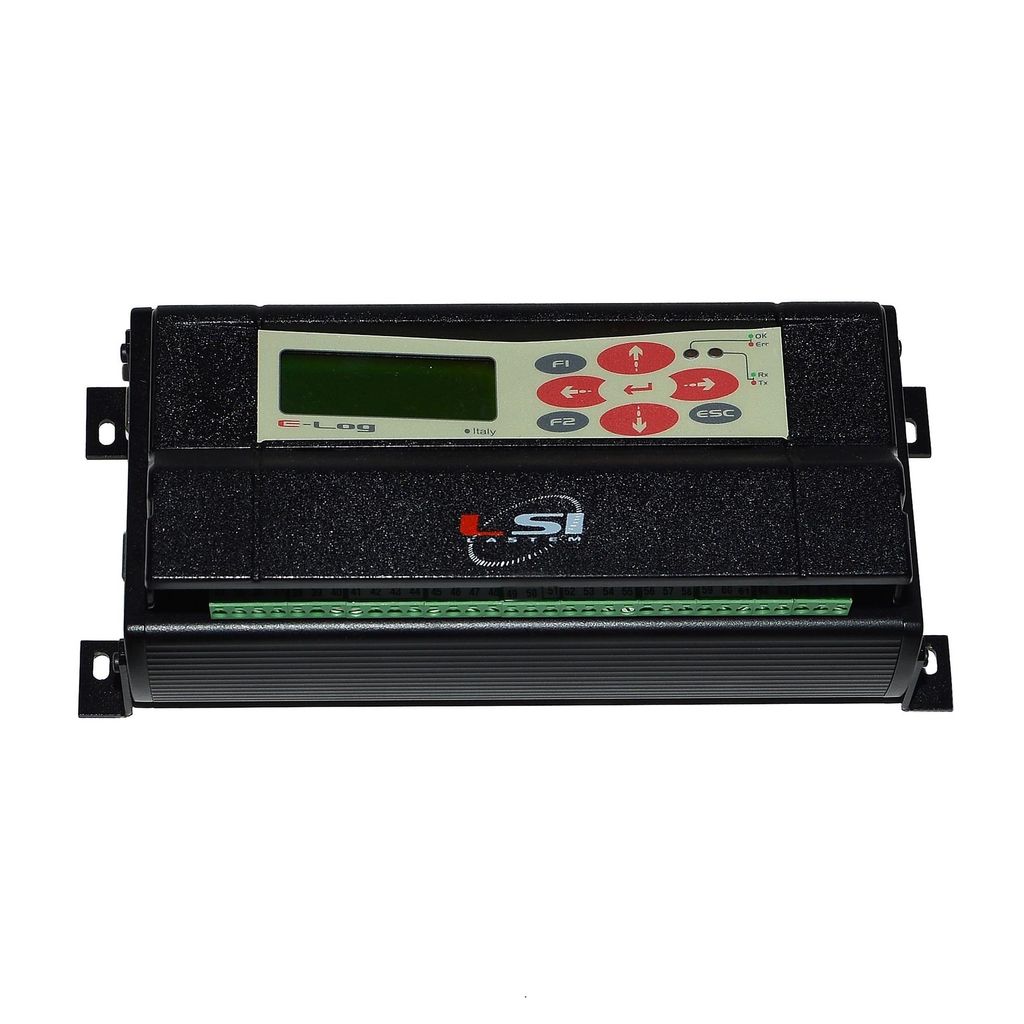
LSI Lastem E-Log Datalogger
*kindly email to sureserv@sureserv.com.my for product inquiry and quotation*
E-Log, equipped with specific inputs for a wide range of sensors and calculations of derived quantities, has been designed for environmental applications even in extreme conditions
Highlights
- N. 8/16 analog inputs, n.4 digital inputs,;
- Input extension using MASTER/SLAVE configurations;
- Extremely low power consumption;
- N. 99 measurements between channels for sensor acquisition and derived quantities;
- Internal library for calculating derived quantities and mathematical calculations;
- 8MB Flash Memory;
- Modbus-RTU Master/Slave, TTY protocols;
- Transmission (push) of data in ASCII format with FTP protocols;
- N. 2 RS232 ports (ELO3305);
- N. 1 RS232 port and N. 1 RS485 port (ELO3305.1);
- Digital outputs to implement external devices with programmable logics or events;
- Acquisition rate from 1 s to 12 hours;
- Elaboration rate from 1 s to 12 hours;
- Connection to the PC via RS232 (USB/Ethernet/Modem GPRS with external accessories);
- Display and keyboard.
Inputs for analog and digital sensors
Free terminal inputs
•N.8 analog diff erential inputs (N.16 single -ended)
• N.4 digital inputs (Pulse/Frequency)
To increase the number of inputs, two E-Log units can be jointed together
using a Master & Slave using a RS232 (ELO3305) or RS485 (ELO3305.1) connection.
Inputs for Serial sensors
The E-Log COM-2 port can be connected to sensors with different protocols:
• Modbus-RTU on RS232 or RS485 (with adapter external DEA504 for model ELO3305, directly for model ELO3305.1)
• GILL (Gill format, polar, continuous)
• BIRAL (SWS050 – SWS100, SWS200 –SWS250)
• LUFFT (UMB binary)
• BOSCHUNG
E-Log can also be connected via RS232 to EXP301 radio receiver to receive signals from LSI LASTEM’s radio sensors (EXP line).
Sensors acquisition rate
Acquisition rate is programmable for each input (from 1 second to 12 hours).
E-Log manages 12 channels from analog sensors and 8 derived quantities in 1 second.
To limit energy consumption from sensors requiring power supply, it is possible to set an advanced power supply from the acquisition event, (warm-up) that is interrupted immediately after the acquisition itself.
Statistical elaboration time base
The raw measured values can be stored directly as instantaneous values, or be stored as statistical processing (from 1 second to 12 hours):
• Average/Minimum/Maximum/Standard Deviation
• Wind elaborations
• Totals
Derived and calculated quantities
Internal library of derived environmental quantities.
These calculations use acquired quantities, constant values and other calculated quantities. The library also includes mathematical functions. (See Derived Quantities table). E-Log manages up to 99 channels
between acquired, derived and calculated quantities.
Data memory
Internal memory (8 MB) allows to store data typically for several weeks. The registration structure is circular.
Storage autonomy is a function of the number of connected sensors and of the confi gured processing rate.
Data communication (devices)
It is possible to transfer data to a PC via:
• RS232, USB (with adapter included )
• RS485 with external adapter (DEA504 / 504.1) for model ELO3305, directly with ELO3305.1
• Modem GPRS (DEA718.3)
• Radio (DEC015.1)
• Ethernet (DEA553)
(see Accessories)
Data communication protocols
Via GPRS modem, data are sent (push mode) to the IP address of a remote PC/Server in ASCII format and FTP protocol. Alternatively, via GPRS or Ethernet, E-Log uses a proprietary binary protocol to transmit data using the LSI LASTEM communication programs: 3DOM, CommNET.
Data communication protocols (Modbus)
In the E-Log models it is possible to send data to Modbus Master devices via:
• Modbus RTU: on RS232 or RS485
• Modbus Encapsulated TCP on Ethernet (using DEA553 adapter)
• Modbus TCP over Ethernet (using DEA509 adapter)
The data transmitted with the Modbus protocol can concern instantaneous values, but also mobile statistical values*.
*Mobile data are values whose statistical basis corresponds to the last observation period. Example: mobile temperature average over 10 minutes (each minute the value is updated always considering the aver-
age value of the last 10 minutes).
To know more kindly visit: https://www.lsi-lastem.com/products/data-loggers/e-log/
